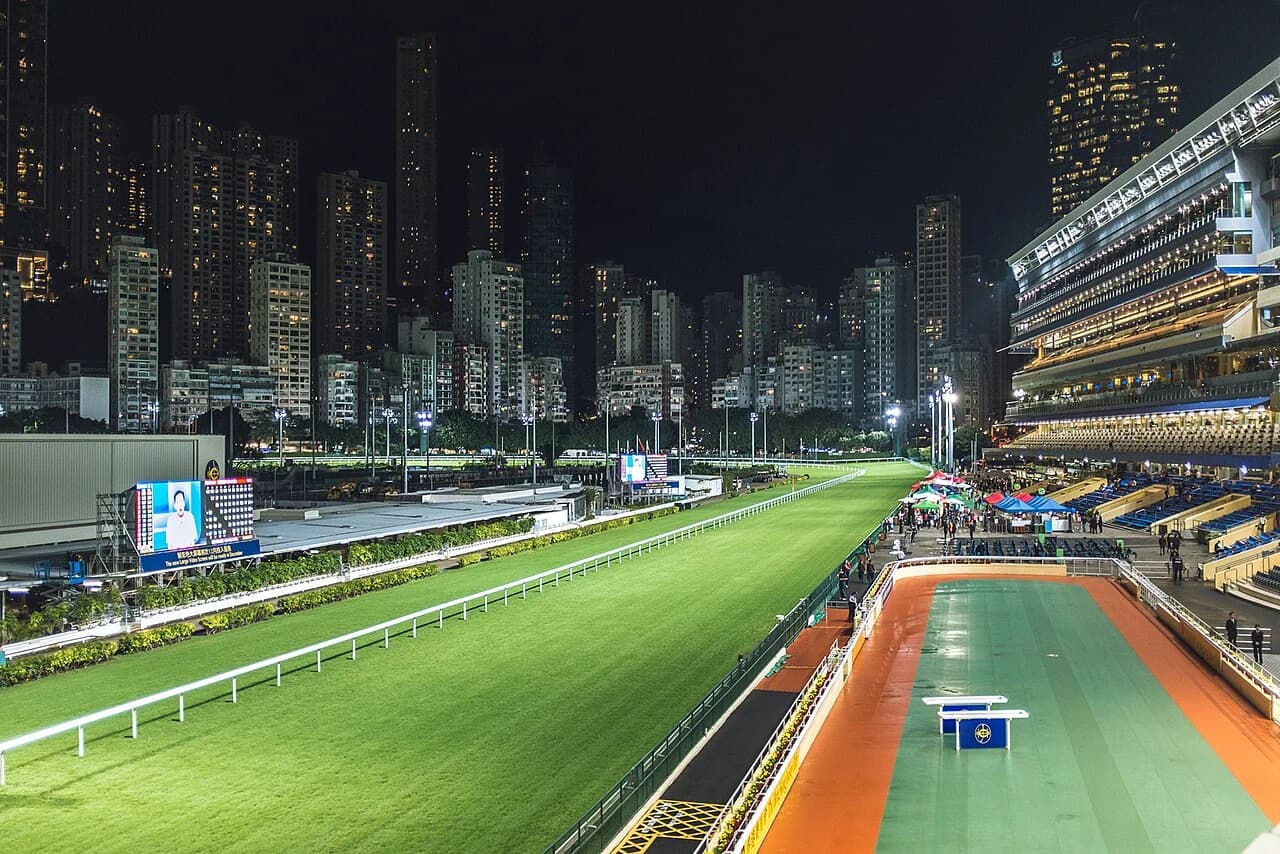
Hong Kong · Happy Valley
Draw Analysis
Data-driven · see the edge in every gate
Happy Valley 1000m barrier performance · full historical record
Data through 2026-09-13
Course
Distance
Going
Turf
A
Course A
Happy Valley 1000m
Sample: 247 Startsavg 8.5%1
14%
3/21
2
10%
2/21
3
19%
4/21
4
10%
2/21
5
10%
2/21
6
5%
1/21
7
14%
3/21
8
5%
1/21
9
0%
0/21
10
5%
1/21
11
5%
1/19
12
6%
1/18
Turf
B
Course B
Happy Valley 1000m
Sample: 302 Startsavg 8.9%1
19%
5/27
2
7%
2/27
3
7%
2/27
4
7%
2/27
5
15%
4/26
6
4%
1/26
7
7%
2/27
8
12%
3/25
9
0%
0/25
10
14%
3/22
11
4%
1/23
12
10%
2/20
Turf
C
Course C
Happy Valley 1000m
Sample: 162 Startsavg 8.6%1
8%
1/13
2
7%
1/14
3
14%
2/14
4
29%
4/14
5
0%
0/14
6
14%
2/14
7
14%
2/14
8
0%
0/14
9
0%
0/13
10
14%
2/14
11
0%
0/12
12
0%
0/12
Turf
C+3
Course C+3
Happy Valley 1000m
Sample: 162 Startsavg 8.6%1
0%
0/14
2
29%
4/14
3
7%
1/14
4
0%
0/14
5
14%
2/14
6
7%
1/14
7
7%
1/14
8
14%
2/14
9
15%
2/13
10
8%
1/13
11
0%
0/12
12
0%
0/12
Shading compares each gate’s rate to the average for its own course and distance. Gates with fewer than 20 starts are left unshaded — the sample is too small to read.