

World Cup 2026 — Top 10 Contenders
Our AI model has analyzed squad strength, tactical systems, qualifying form, and historical data across 10,000 Monte Carlo simulations to identify the 10 teams most likely to lift the trophy. Click any team for a deep-dive analysis.
🏆 Ranking

France
Team Ratings
Star Players




Tournament Path Forecast
WC Experience
Physical
Chemistry
Lambda
OddsFlow AI Climate Report — 16 Venues, 3 Nations
How heat stress across North America could shape the 2026 World Cup
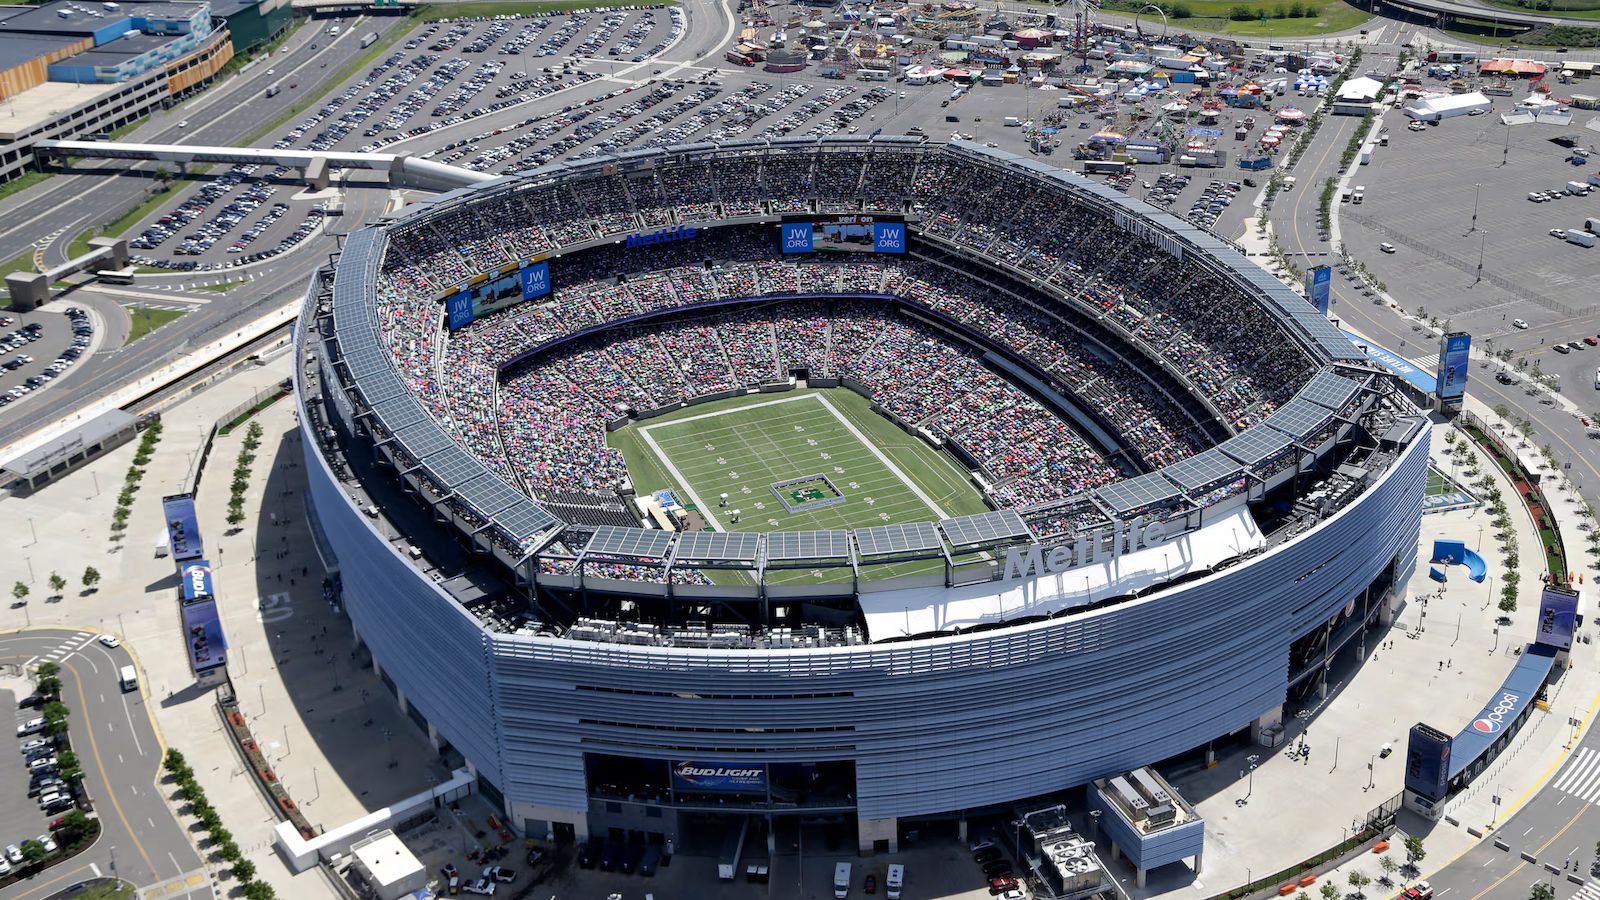
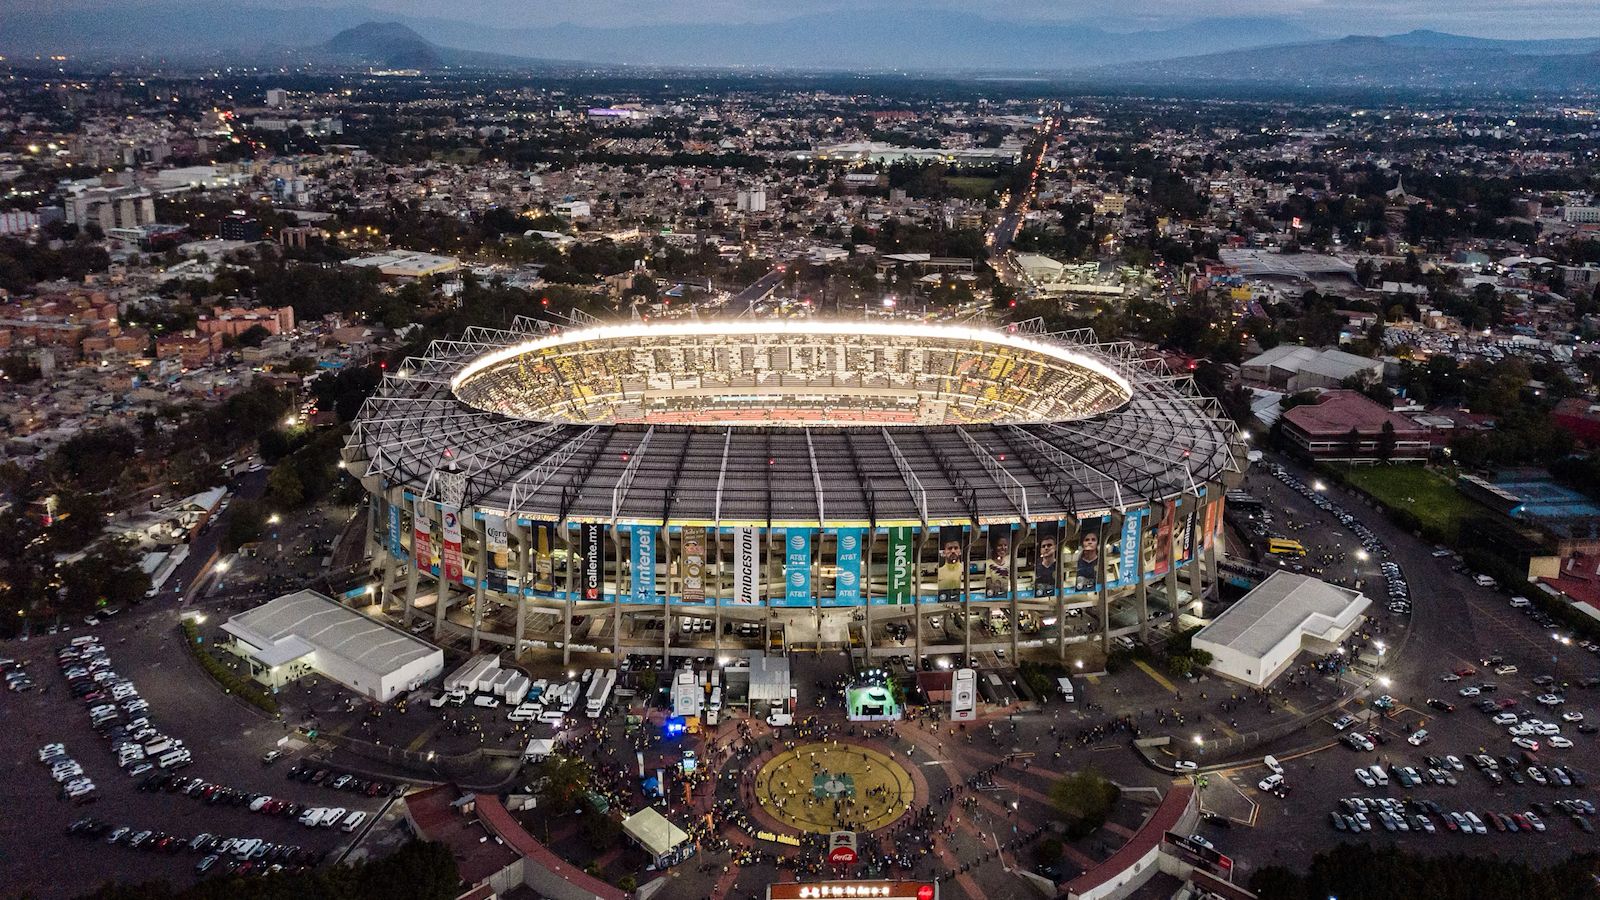
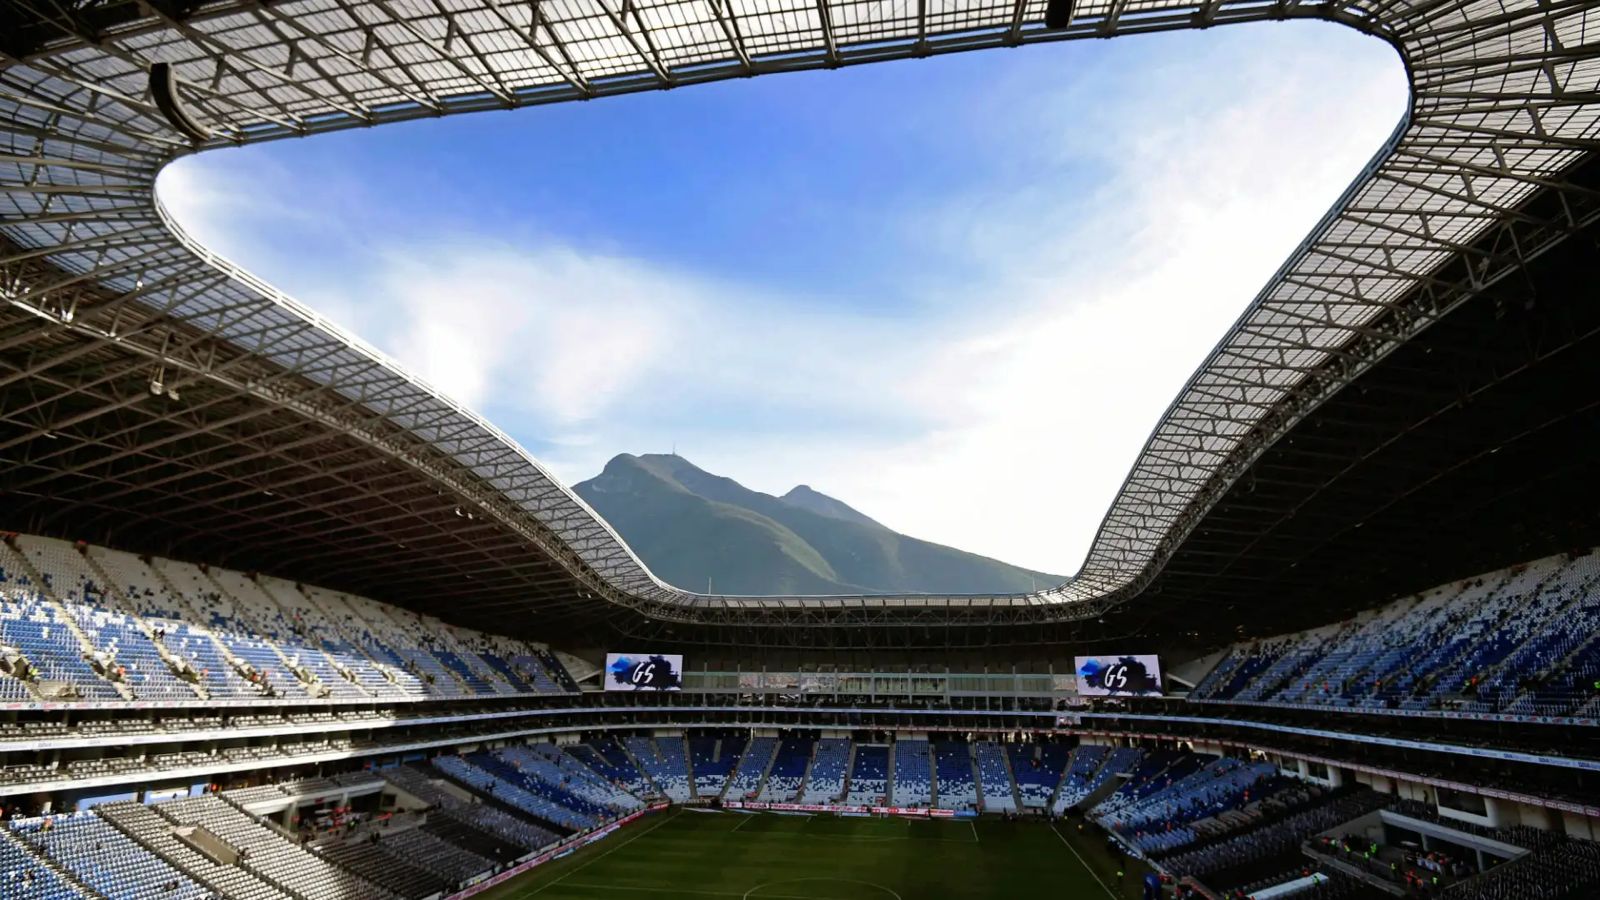
OddsFlow's AI model has analyzed 10-year median wet-bulb globe temperature (WBGT) data across all 16 host cities. Our analysis reveals a 14°C spread between the coolest venue (Vancouver, 18°C WBGT) and the hottest (Monterrey, 36°C WBGT). Southern venues — Houston, Dallas, Miami, and Monterrey — exceed the 28°C threshold where FIFA's mandatory cooling breaks activate, potentially disrupting high-press tactics favored by European contenders.
Teams drawn into southern groups face a measurable disadvantage: our simulations show high-pressing sides lose 6–9% expected distance covered per match in WBGT conditions above 30°C. Conversely, counter-attacking teams like Mexico and Saudi Arabia may gain a tactical edge at these venues. The host city lottery could prove as decisive as the group draw itself.
Powered by OddsFlow World Cup AI Model

Hi, I'm Daniel 👋
Get 1 FREE Live AI Signal — No Delay
Join our Telegram and get a real-time AI signal for the next match — zero delay, no signup required. See our AI predictions in action.