
The Concept That Changed How I Think About Sports Data
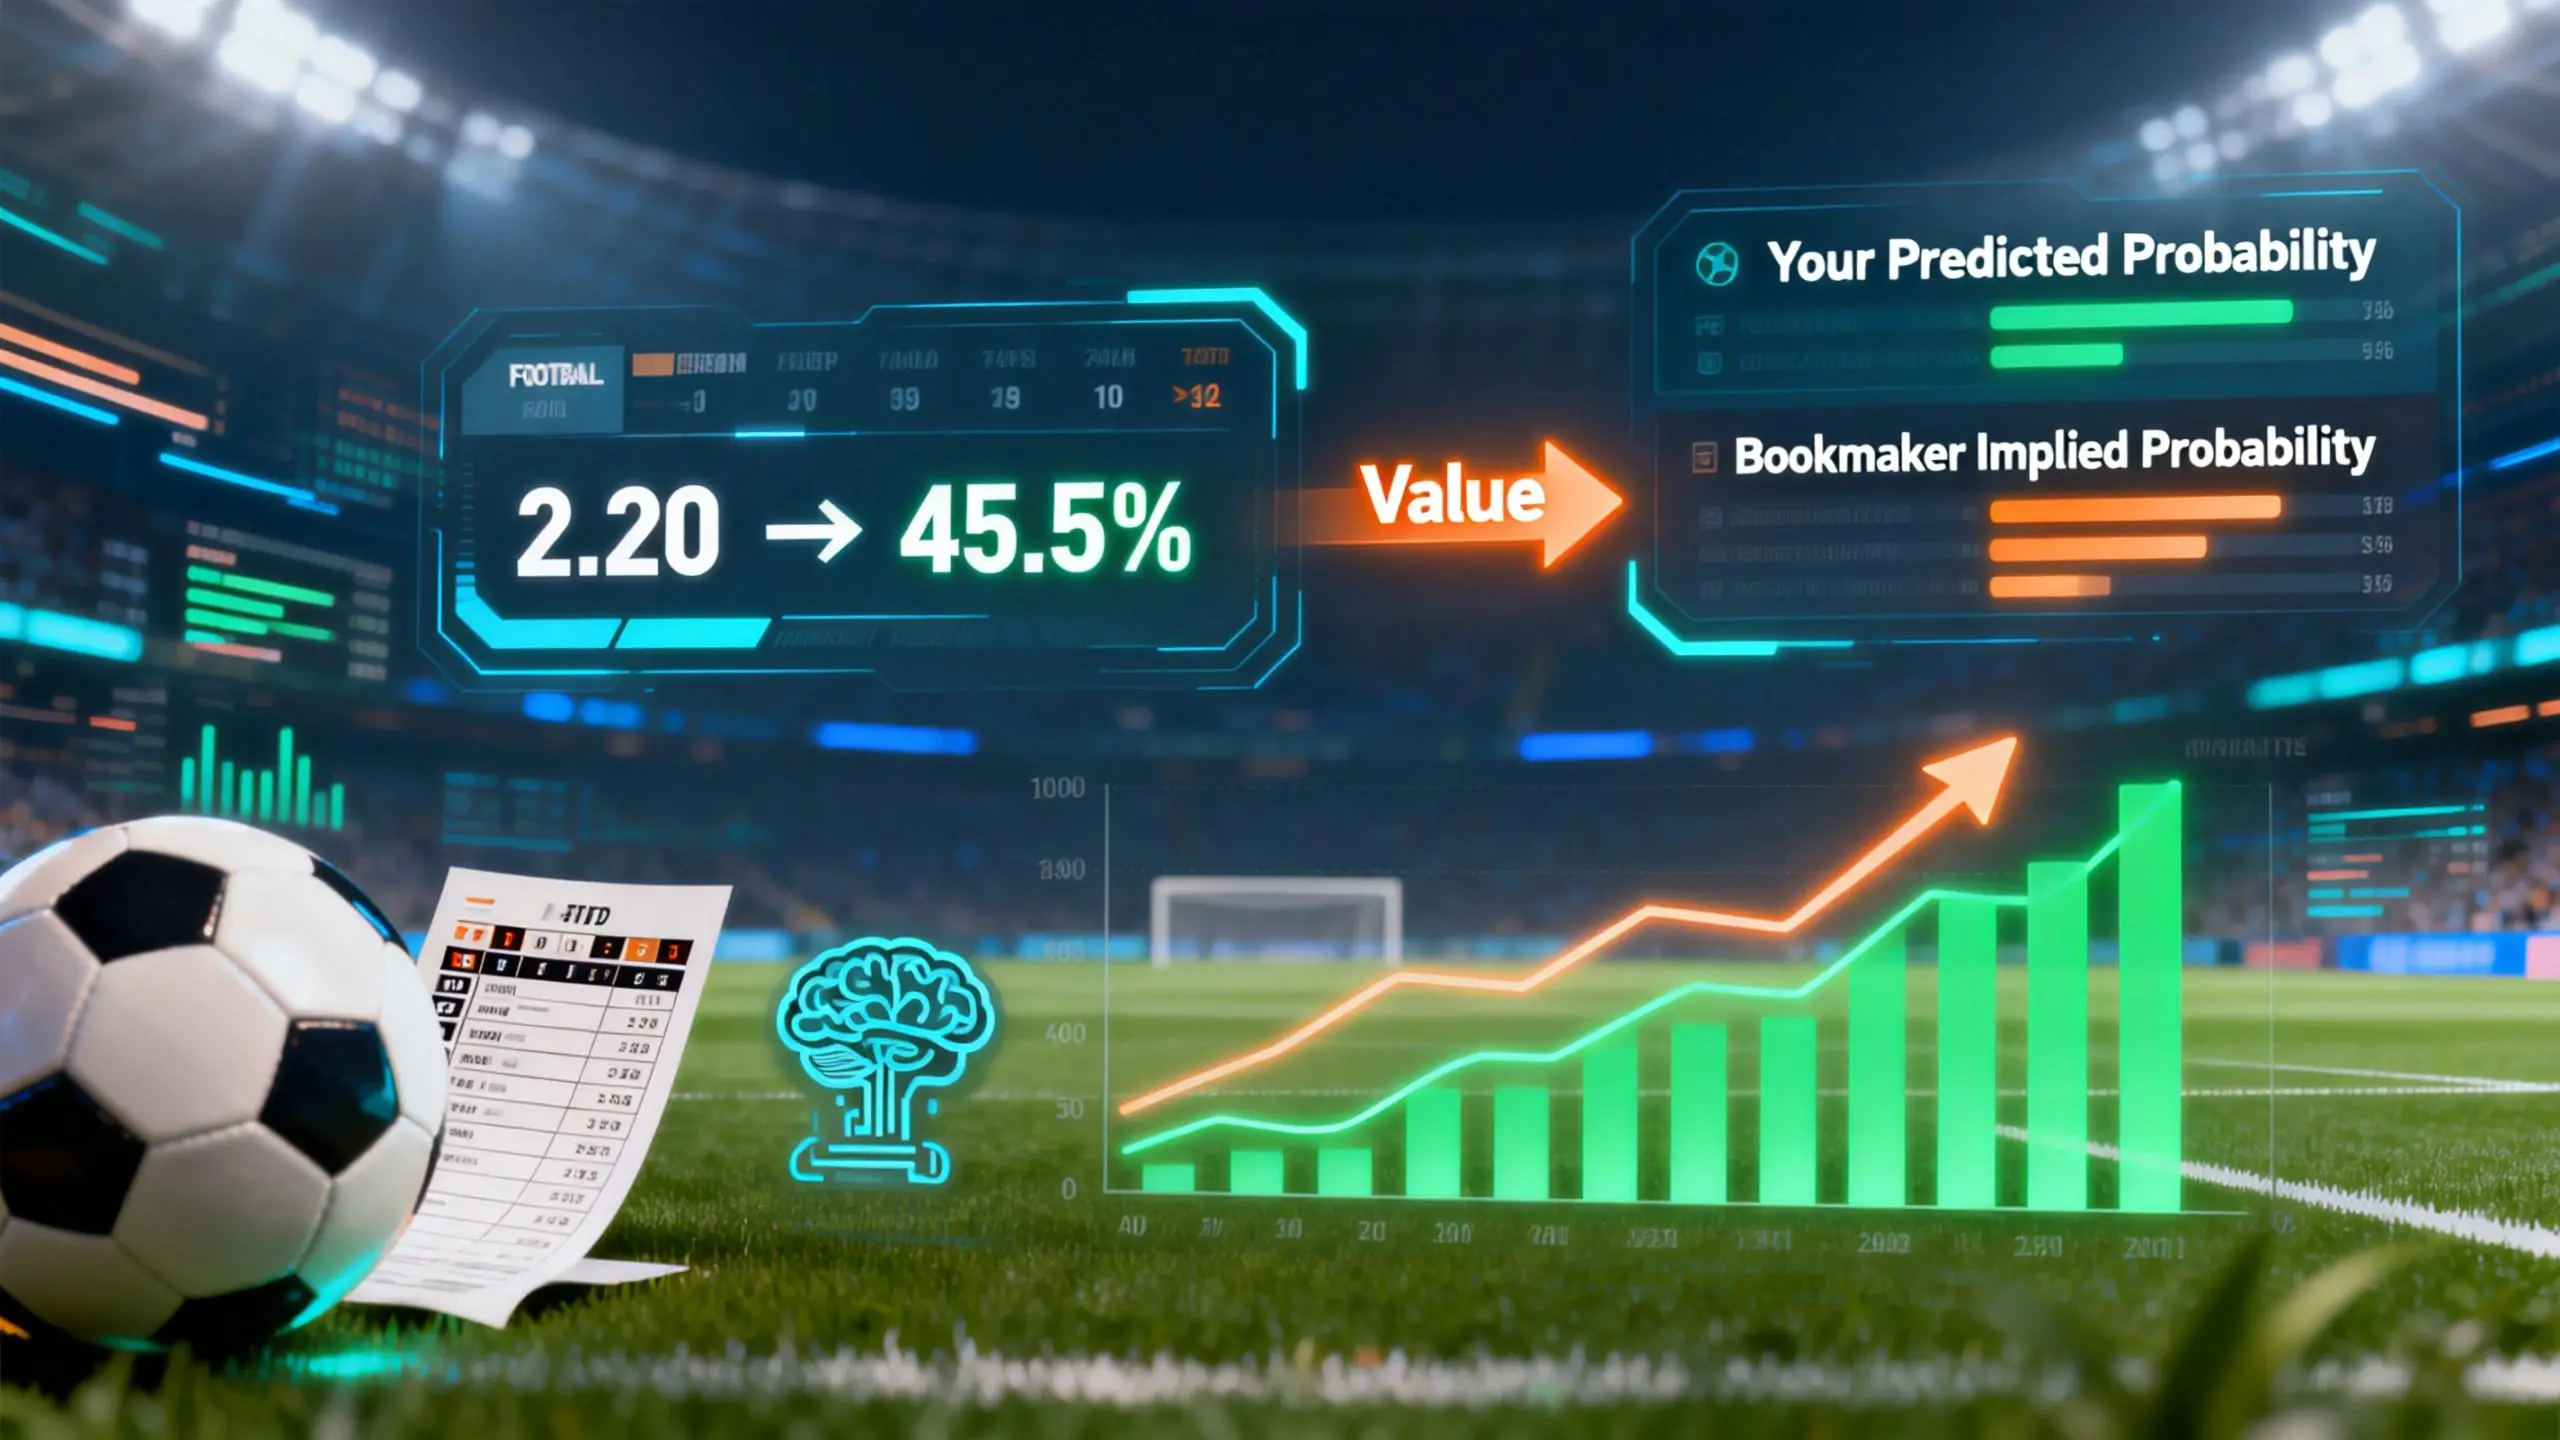
When I first started building prediction models, I thought odds were just arbitrary numbers set by companies. Then I learned about implied probability, and everything clicked.
Here's the insight: every set of odds is actually a probability estimate in disguise. Learning to extract that estimate—and compare it to your own models—is fundamental to sports analytics.
The Conversion Formula
The math is beautifully simple:
Implied Probability = 1 / Decimal Odds
That's it. A 2.00 odds line implies a 50% probability. A 4.00 odds line implies 25%.
| Decimal Odds | Implied Probability |
|---|
| 1.50 | 66.7% |
| 2.00 | 50.0% |
| 2.50 | 40.0% |
| 3.00 | 33.3% |
| 4.00 | 25.0% |
Why This Matters for AI Models
At OddsFlow, implied probability is a core input feature for our machine learning models. Here's why it's so valuable:
1. Market consensus signal
Odds represent aggregated beliefs from millions of participants. That's a powerful wisdom-of-crowds signal.
2. Calibration benchmark
Comparing your model's probability output to implied probability shows you where your model disagrees with the market—and by how much.
3. Feature engineering
The *difference* between your predicted probability and implied probability (often called "edge" or "value") is itself a predictive feature.
Expected Value: The Core Metric
When your model predicts a different probability than the market implies, you can quantify that discrepancy:
Expected Value = (Model Probability × Decimal Odds) - 1
Example:
- Your model: 50% probability for Team A to win
- Market odds: 2.50 (implied: 40%)
- EV = (0.50 × 2.50) - 1 = +0.25 (+25%)
A positive EV suggests your model sees something the market doesn't. Whether that's signal or noise depends on your model's track record.
The Overround: Understanding Market Efficiency
One quirk: implied probabilities from all outcomes won't sum to 100%. They'll be higher—typically 102-108% for major markets. That excess is called the "overround" or "margin."
Example 1X2 market:
- Home: 2.10 → 47.6%
- Draw: 3.40 → 29.4%
- Away: 3.60 → 27.8%
- Total: 104.8%
To get "true" implied probabilities, normalize by dividing each by the sum.
Practical Applications
For analysts: Compare implied probabilities across different data sources to spot inefficiencies.
For model builders: Use implied probability as both a feature and a calibration target.
For researchers: Track how implied probabilities shift pre-match to study information flow in markets.
📖 Related reading: Understanding Market Margins • Odds Movement Analysis
*OddsFlow provides AI-powered sports analysis for educational and informational purposes.*