
The Moment I Realized Win Rate Was Lying to Me
Early in my data science career, I built what I thought was a great prediction model. It had a 68% win rate on test data. I was thrilled.
Then someone asked me a simple question: "What's your Brier score?"
I had no idea what that was. So I calculated it. Turns out my "68% accurate" model was actually *worse* than just using market consensus probabilities. How?
Because my model was overconfident. It was saying 85% when it should have said 60%. The high win rate was masking terrible probability estimates.
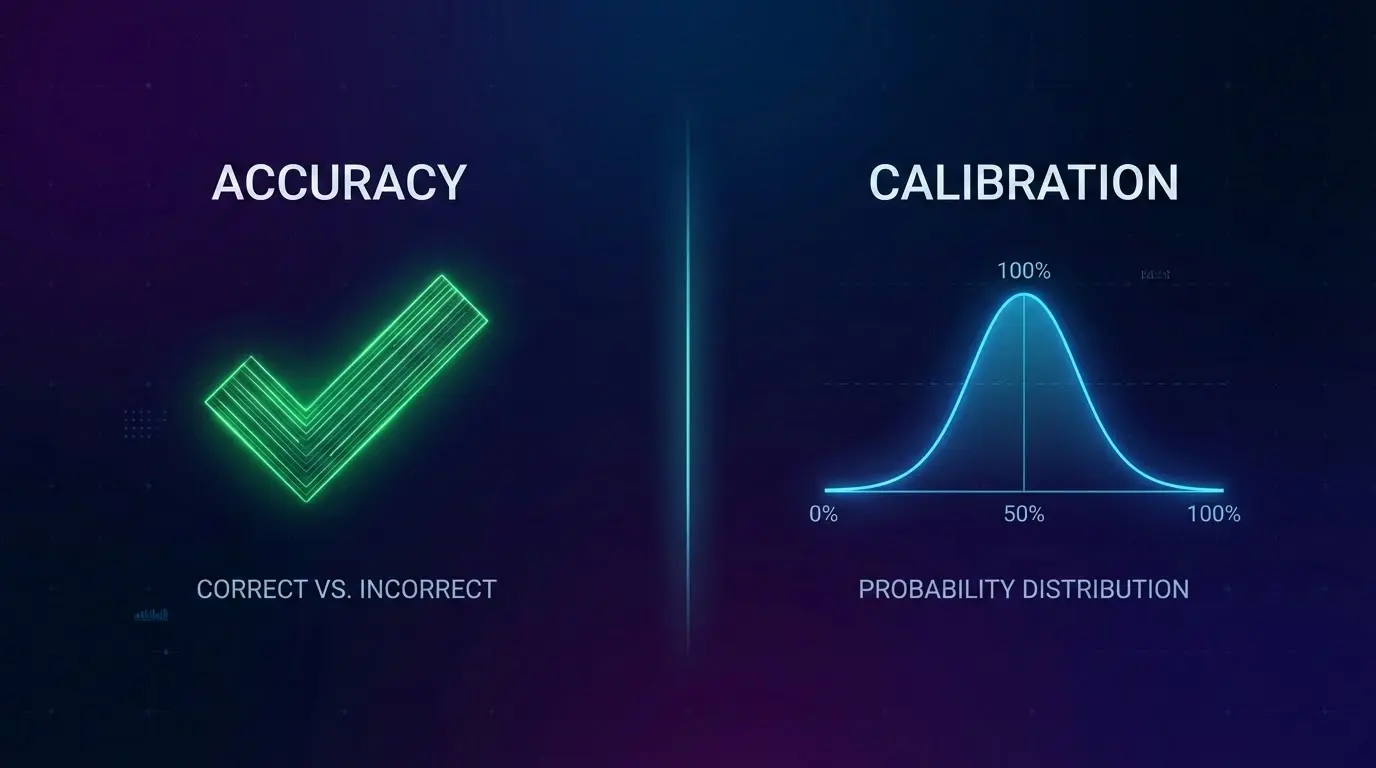
That day I learned the difference between accuracy and calibration.
What Calibration Actually Means
Here's the simplest definition I can give:
A calibrated model's 60% predictions should come true about 60% of the time.
If you predict 60% for 100 different matches, roughly 60 of them should happen. Not 80, not 40—about 60.
Sounds obvious, right? But most models fail this test badly.
Why Win Rate Alone Is Dangerous
Win rate tells you how often your top prediction was correct. But it ignores everything else:
Problem 1: Confidence level
If you predict Home Win at 51% and it happens, that's a win. If you predict Home Win at 90% and it happens, that's also a win. Same credit, completely different quality.
Problem 2: Probability distribution
A model that says "every match is 50/50" would be horribly useless, even if it somehow hit 50% accuracy.
Problem 3: It rewards overconfidence
Models learn to be more extreme because it looks good in hindsight. "I said 80% and was right!" But were you right often enough to justify 80%?
How We Actually Evaluate Our Models
We use two main metrics:
Brier Score
This measures the squared difference between your predicted probability and what happened. If you said 70% and it happened, you get a small penalty. If you said 70% and it didn't happen, you get a larger penalty.
Lower is better. A perfect Brier score is 0. Random guessing gets you 0.25.
Calibration Buckets
We group all predictions by confidence level:
- All predictions between 50-60%
- All predictions between 60-70%
- And so on...
Then we check: did the 50-60% bucket actually hit around 55% of the time? Did the 70-80% bucket hit around 75%?
If your buckets are off, your model is miscalibrated—it's lying about how confident it really should be.
A Real Example From Our Data
Here's what we found when we audited one of our older models:
| Predicted | Actual | Verdict |
|---|
| 50-60% | 54% | Good |
| 60-70% | 61% | Good |
| 70-80% | 68% | Slightly overconfident |
| 80-90% | 71% | Very overconfident |
We had to retrain with calibration constraints to fix this.
Why This Matters Beyond Numbers
Calibration isn't just a technical metric. It's about honesty.
When our system says there's a 75% chance of something, we want that to mean something real. Not "75% of the time I'm confident" but "75% of these things actually happen."
Users can trust calibrated predictions. They can make informed decisions. Uncalibrated predictions are just noise dressed up as insight.
How We Built Calibration Into Our Pipeline
- 1Train on proper probability scores, not just accuracy
- 2Validate on held-out data from different time periods
- 3Plot calibration curves after every model update
- 4Compare against market baselines—if we're not beating consensus, what's the point?
This isn't easy. It's slower than chasing win rate. But it's the only way to build something trustworthy.
Key Takeaways
- 1Win rate can hide overconfident, poorly calibrated models
- 2Calibration means your probabilities match reality
- 3Brier score measures probability quality, not just correctness
- 4Test your model's calibration across different confidence levels
- 5Compare against baselines—beating random isn't enough
📖 Related reading: How We Build Features • Backtesting Properly
*OddsFlow provides AI-powered sports analysis for educational and informational purposes.*