
The First Time I Noticed Something Interesting
When I started tracking odds data for our models, I made the same mistake most people make: I only looked at opening and closing prices. Two data points per match. That's it.
Then one day, I actually plotted the full timeline for a match. The line wasn't straight—it had curves, sudden drops, periods of stability, and last-minute spikes. I realized I'd been throwing away 90% of the signal.
That's when I started thinking about odds movement not as noise, but as structured data.
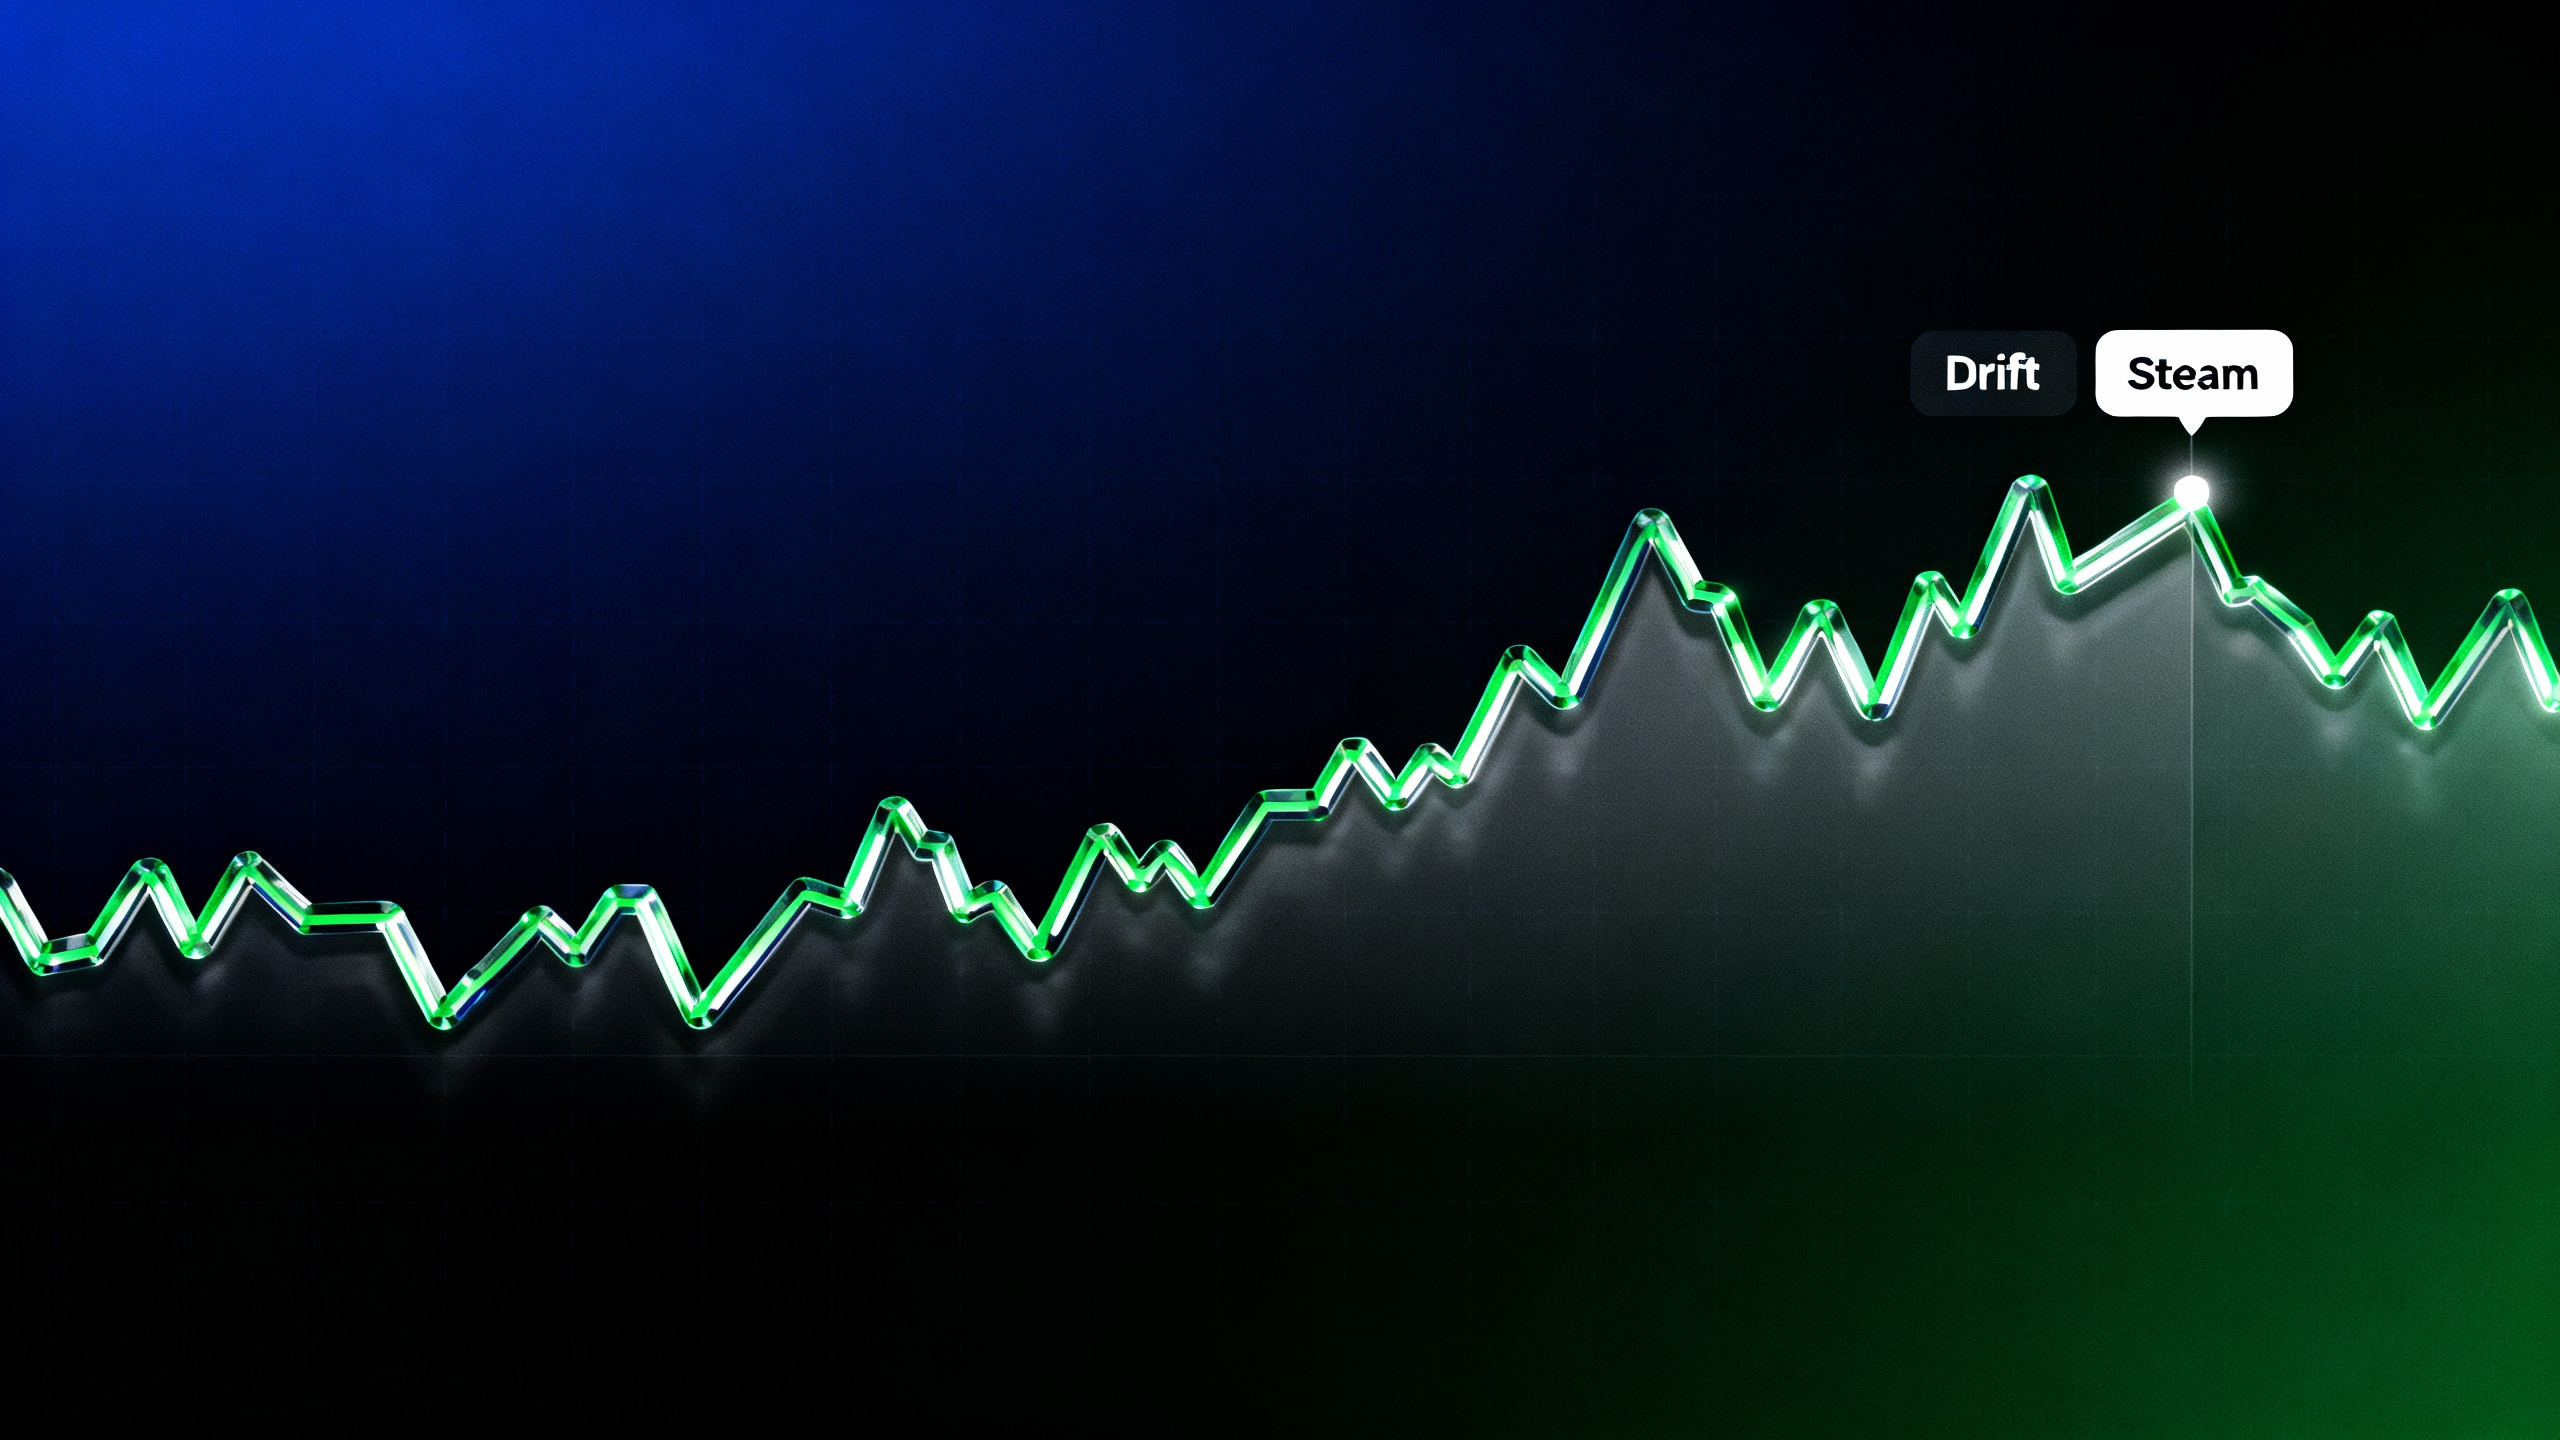
Steam and Drift: The Basic Vocabulary
Let me give you the terms we use internally:
Steam is when odds shorten—the implied probability goes up. If a team opens at 3.00 (33% implied) and drops to 2.50 (40% implied), that's steam. Something is pulling the market toward that outcome.
Drift is the opposite. Odds lengthen, implied probability drops. Maybe the market is backing away from an outcome, or money is flowing elsewhere.
Here's the thing though: the labels aren't what matters. What matters is *how* and *when* the movement happens.
Stability Is the Feature Nobody Talks About
Two matches can end at exactly the same closing odds but take completely different paths to get there.
Match A opens at 2.00, stays between 1.95-2.05 all day, closes at 2.00. Stable.
Match B opens at 2.00, swings to 2.40, drops to 1.80, bounces to 2.20, closes at 2.00. Choppy.
From a closing-odds perspective, they're identical. But from a signal perspective? Totally different stories.
We measure stability using standard deviation of the odds path, and it turns out to be one of our more predictive features. High volatility often indicates market uncertainty or conflicting information.
Late Movement Gets Special Treatment
Here's something we learned from analyzing millions of matches: movement in the last few hours before kickoff behaves differently than early movement.
Why? Late movement incorporates:
- Final lineup confirmations
- Last-minute injury news
- Weather updates
- Information that wasn't available earlier
We separate our movement features into "early" (before T-4 hours) and "late" (final 4 hours) windows. The late window tends to be more informative, but also more noisy if you're not careful about how you process it.
How We Turn Movement Into Features
Raw odds movement is messy. Here's how we clean it up:
Delta (Δ): The simple change from opening to current implied probability. If it opened at 35% and now sits at 42%, delta is +7 percentage points.
Velocity: How fast is it moving? A 7-point change over 24 hours is very different from 7 points in 30 minutes.
Volatility: The standard deviation of the path. Are we getting there smoothly or through chaos?
Late intensity: What percentage of the total movement happened in the final window?
These become columns in our feature matrix. The model learns which patterns are predictive.
A Real Example
Let me walk you through one we tracked recently. Match was scheduled for 3pm. Here's what the home win probability looked like:
- 9am (opening): 45%
- 11am: 46%
- 1pm: 47%
- 2pm: 52% (jump)
- 2:30pm: 54%
- Kickoff: 55%
See that jump at 2pm? That's classic late steam—probably lineup news or a significant late piece of information. The smooth rise from 45-47% in the morning? That's gradual market adjustment.
Our model treats these differently. The late jump gets flagged as a separate signal. The morning drift gets measured for consistency.
What I Tell New Team Members
When someone joins our data team, I always say: odds movement isn't about predicting where prices go. It's about extracting information from *how* they got there.
The market is a giant information processor. Every price change reflects someone's decision. We're not trying to outsmart the market—we're trying to measure what it's telling us.
Key Takeaways
- 1Steam = probability rising, Drift = probability falling
- 2Stability is a feature, not just noise
- 3Late movement deserves separate analysis
- 4Turn raw movement into structured features (delta, velocity, volatility)
📖 Related reading: Opening vs Closing Odds • Bookmaker Consensus
*OddsFlow provides AI-powered sports analysis for educational and informational purposes.*