
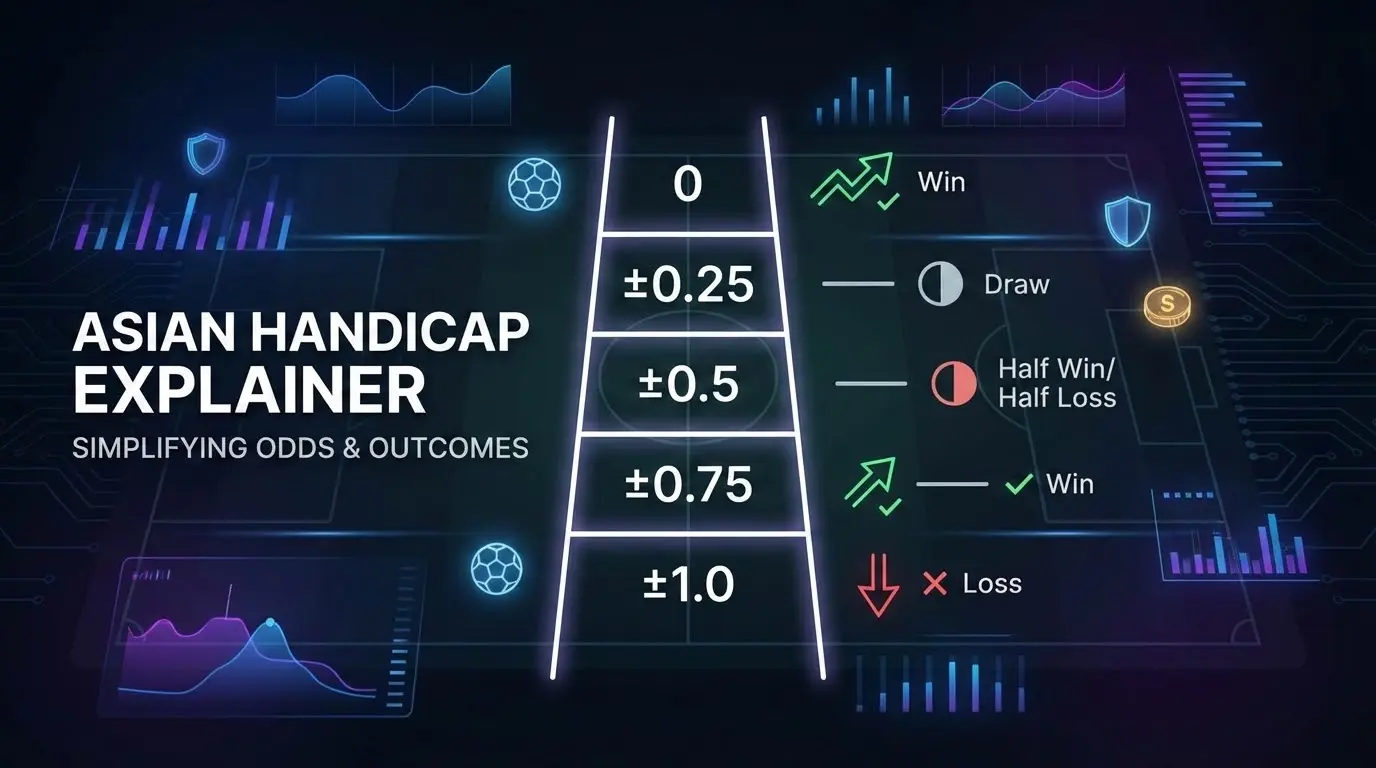
Why Asian Handicap Is Useful for Analysis
When I first started building football models, I found Asian Handicap lines confusing. Why all the decimals? What's with the quarter lines?
Then I realized: AH lines are actually one of the cleanest ways to express "how much stronger is team A than team B" in a single number.
This guide breaks down the mechanics, but more importantly, shows how to read AH data as probability signals for your own analysis.
The Core Concept
Asian Handicap adjusts the final score by applying a virtual handicap to one team. This eliminates the draw outcome and creates a cleaner two-way market.
| Line | What It Means |
|---|
| -0.5 | Must win outright |
| +0.5 | Can draw and still cover |
| -1.0 | Must win by 2+; win by 1 = push |
| +1.0 | Lose by 1 = push; lose by 2+ = doesn't cover |
Quarter Lines: Simpler Than They Look
Quarter lines (±0.25, ±0.75) confused me until I learned they're just split positions:
- -0.25 = half at 0, half at -0.5
- +0.75 = half at +0.5, half at +1.0
If the match lands between the two lines, you get a partial result. That's it—no special math needed.
Reading AH as Probability Data
Here's where it gets interesting for analysis. Every AH price can be converted to implied probability:
Formula: P = 1 / Decimal Odds
A team at -0.5 with odds of 1.85 implies roughly 54% probability of winning outright.
When I compare AH lines across different matches, I convert everything to probabilities first. This makes patterns visible that raw odds obscure.
How We Use AH at OddsFlow
AH data is valuable for our models because it captures team strength differential more directly than 1X2 markets. Common features we extract:
- Line value: -0.75 vs -0.25 indicates different strength gaps
- Fair probability: after removing margin, what does the market really think?
- Line movement: if handicap shifts from -0.5 to -0.75 before kickoff, that's meaningful
- Cross-market consistency: does AH align with totals and 1X2?
This isn't about finding edges—it's about understanding what market data is telling us.
Quick Reference
| Line | Coverage Condition | Probability Signal |
|---|
| 0 | Win covers, draw pushes | Near 50-50 perceived |
| -0.5 | Must win | Slight favorite |
| -1.0 | Win by 2+, win by 1 pushes | Clear favorite |
| Quarter lines | Split between adjacent lines | Between those thresholds |
Common Questions
What's the practical difference between -0.25 and -0.5?
-0.25 gives you insurance on a draw (half refund). -0.5 is all-or-nothing.
Does AH tell me who will win?
No. It tells you what the market thinks about relative strength at a specific moment.
📖 Related reading: Over/Under as Tempo Signals • Understanding Market Margins
*OddsFlow provides AI-powered sports analysis for educational and informational purposes.*